Forthcoming 2007/2008 Mars
(14)
Coming
NPC in 2008
CMO #338 (25 November
2007)
Masatsugu
MINAMI
|
|
|
F |
rom this apparition,
we are to observe the planet Mars of the northern season in a favourable
condition. First of all we are concerned with the north polar cap (npc). On
In any macroscopic world it is quite rare to have a
linear variation, while at the regression of the npc, there is one example
which claims a linear recession 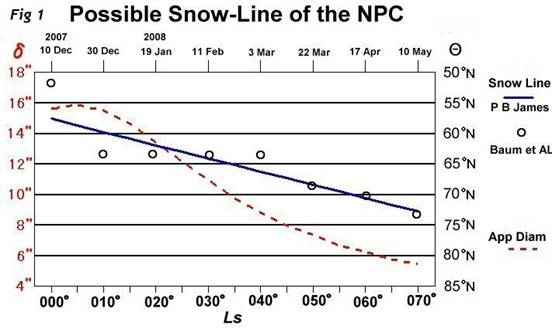 curve such that Θ=57.7°+ 0.216×λ, where Θ is the
latitude of the snow line: This was put forward by P B JAMES in Icarus 52
(1982) 565 and based on the Viking data in 1979/1980. At λ=000°Ls, Θ=57.7°N, and λ=010°Ls, Θ= 59.9°N. At λ=355°Ls, just before
equinox, there seem to exist good red and blue images of the npc which told
Θ= 55°N; this result however is not necessarily on the line.
curve such that Θ=57.7°+ 0.216×λ, where Θ is the
latitude of the snow line: This was put forward by P B JAMES in Icarus 52
(1982) 565 and based on the Viking data in 1979/1980. At λ=000°Ls, Θ=57.7°N, and λ=010°Ls, Θ= 59.9°N. At λ=355°Ls, just before
equinox, there seem to exist good red and blue images of the npc which told
Θ= 55°N; this result however is not necessarily on the line.
Figure 1 was made by M MURAKAMI (Mk), and the
line on the Fig is the James straight line. The dotted line has nothing to do
with the npc recession, but is just shown to assert how this apparition is
favourable (not best favourable) to watch the rudimental state of the npc.
P B JAMES had already published the recession curve of
the 1977/1978 npc based on the Viking early data in JGR 84 (1978)
8332 in which the npc did not thaw linearly: As mentioned in CMO#130 (25 Feb
1993), the npc looked to come to halt around from λ=010°Ls to 030°Ls 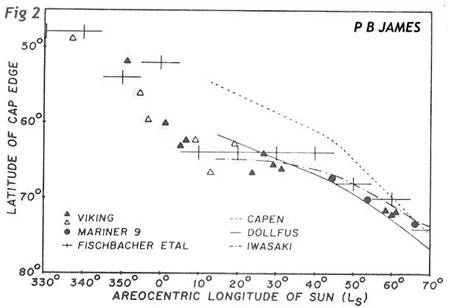 and it belongs to the Baum plateau (as we called so there).
We here cite his Fig. 1 as Fig. 2 here. Apparently JAMES knows well about the
Baum standstill (originally in FISCHBACHER et al 1969). Here IWASAKI implies
the work by Kyosuke IWASAKI and others at the Kwasan Observatory,
and it belongs to the Baum plateau (as we called so there).
We here cite his Fig. 1 as Fig. 2 here. Apparently JAMES knows well about the
Baum standstill (originally in FISCHBACHER et al 1969). Here IWASAKI implies
the work by Kyosuke IWASAKI and others at the Kwasan Observatory,
What's the Baum plateau? W A BAUM and L J MARTIN
published an exquisite work on the polar caps with G E FISCHBACHER based on the
Lowell plate collection covering more than 60 years, and as a by-product they
put forward a figure which showed a recession of the npc. In 1973, BAUM and
MARTIN revised the plots adding the results obtained by the IPP (Bull. Am. Astron. Soc. 5 (1973) 296). Here we cite their
work as Fig 3 cited from W BAUM, in Exploration of the Planetary System
241-251 (1974) (ed. Woszczyk & Iwaniszewska), "Results of Current Mars
Studies at the IAU Planetary Research Center." Just we here beg his pardon
if we reverse his figure in our way because he uses a conversion where the
north is upward. This shows apparently 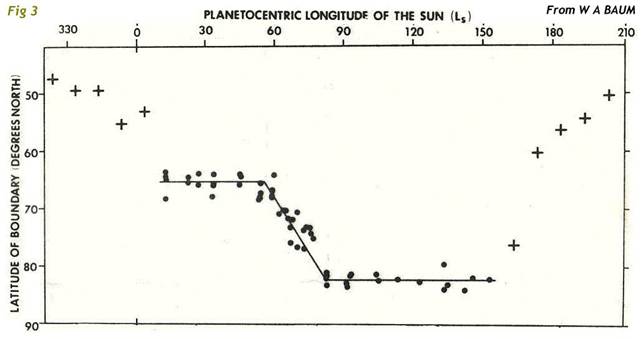 the npc comes to a standstill from λ=010°Ls to λ=060°Ls. The essence of
this plateau was first shown us from Audouin DOLLFUS since his work on the npc
recessions in 1946, 1948 and 1950 was compared with the work of BAUM and
others. The Dollfus curve was cited in CMO #109 (15 Sept 1991) p0944 (by the
courtesy of Prof DOLLFUS) in which Baum plateau was shown as halting dots on λ=010°Ls, 020°Ls, 030°Ls, 040°Ls. These were used
in Fig 1 here. Note that it stopped at λ=040°Ls in early work, but
in Fig 3 it was extended to λ=060°Ls because a new data was added (what year was it when
the new dot was obtained?). Incidentally the Dollfus curve (very well-known)
does not show any data at around λ=000°Ls, and those at λ= 020°Ls and λ=030°Ls look to suggest a
halt. At λ= 040°Ls the diagram implies that the snow line was lower
than the Baum's dot.
the npc comes to a standstill from λ=010°Ls to λ=060°Ls. The essence of
this plateau was first shown us from Audouin DOLLFUS since his work on the npc
recessions in 1946, 1948 and 1950 was compared with the work of BAUM and
others. The Dollfus curve was cited in CMO #109 (15 Sept 1991) p0944 (by the
courtesy of Prof DOLLFUS) in which Baum plateau was shown as halting dots on λ=010°Ls, 020°Ls, 030°Ls, 040°Ls. These were used
in Fig 1 here. Note that it stopped at λ=040°Ls in early work, but
in Fig 3 it was extended to λ=060°Ls because a new data was added (what year was it when
the new dot was obtained?). Incidentally the Dollfus curve (very well-known)
does not show any data at around λ=000°Ls, and those at λ= 020°Ls and λ=030°Ls look to suggest a
halt. At λ= 040°Ls the diagram implies that the snow line was lower
than the Baum's dot.
It should be remarked that the Baum-Martin diagram is
made from the selected excellent data in an averaged form ranging over 60
years. Therefore it shows no more than a general tendency and does not imply
the trend is all the same every Martian year. So it is not impossible if such a
linear case as in 1979/80 is found. It was suggested the case was the one when
no dust storm preceded the npc season, while it was
known in 1977 preceding the 1977/79 case that two great dust storms appeared.
So does the Baum-Martin diagram imply that the dust storm occur every Martian
year in an averaged sense?
Since at the spring equinox the pole-to-pole grand
circulation changes its direction via the equator-to-pole circulation, it is
plausible the changing at the pole is accomplished slowly in a macroscopic
world so that the wind-blow dies down for a while, though an instantaneous
return is possible in a mathematical chart (no dust case or more in a vacuum
atmosphere?). If the wind remains to die for a while, the recession of the npc
also must come to a standstill. The retardation may be affected by several
macroscopic elements, and the distribution of dust may be an ingredient. If a
delay proves enough for the npr to become warmer than
the equator band, the npr will became well ventilated. So we should say that
the halt or retardation may be different from  year to year depending upon some hidden conditions;
that is, the delay may not occur, or a shorter delay may occur or a longer
delay may appear, different continuously. Since we are not necessarily allowed
to chase the npr every Martian year, we need to file
up the data when it is possible for a longer period.
year to year depending upon some hidden conditions;
that is, the delay may not occur, or a shorter delay may occur or a longer
delay may appear, different continuously. Since we are not necessarily allowed
to chase the npr every Martian year, we need to file
up the data when it is possible for a longer period.
Previously we had chances to chase the recession of
the npc in 1990 and 1992. However as shown in a chart in CMO #327 (
Back to the Index/Back to the CMO Home Page
/ Back to the CMO Façade