2 0 0 9Ā P a r i s / M
e u d o n
IWCMO Conference
Christophe PELLIER: A REVIEW OF THE LAST MARTIAN DUST STORMS
Talk at the IWCMO meeting, 19th September 2009
|
T |
he purpose of this talk is to present a recently identified kind of dust
storm on Mars, the öcross-equatorialö
dust storms, and to compare them with what will
be called here the öclassical dust
stormsö. During the last ten years, our
knowledge about planet Mars has been greatly improved by the launch of several orbiters (Mars Global Surveyor, Mars Odyssey, Mars Express
and so on). During the meantime, the technical tools available to amateur
astronomers have known a big increase in quality, thanks to the introduction of
CCD cameras, then webcams, and finally fast uncompressed video cameras. We propose
to review the last 10 years dust activity of Mars thanks to both professional
and amateur data.
1░ü Two models of dust storms
The model for the öclassical
dust stormsö has been historically drawn to explain the global or encircling dust events that are sometimes
observed on Mars (like in 1909, 1956, 1971üc). ItÆs declined with the following criterions :
Ę They start in the southern hemisphere of Mars, from favourable sites
mostly located around the
Ę They begin preferentially during late southern spring or southern summer
(Ls 250-270░), as we have to wait for the atmospheric pressureÆs increase to generate
winds strong enough to lift dust clouds. This season corresponds to the passage
of the planet at its perihelion ;
Ę The main mechanism responsible for the global diffusion of dust is the
½ positive feed-back ╗. The dust lifted in the atmosphere absorbs the
infrared emission from the Sun, heating the upper atmosphere of Mars; this
increase in temperatures enhances the dominant winds, and they lift finally
more dust in the atmosphere, and so on.
Ę The unique spring / summer Hadley cell is the second mechanism that
allows global spreading of dust. A Hadley cell is a vertical, latitudinal,
atmospheric circulation in a planetÆs
atmosphere. On Mars, this unique cell has
its ascending branch near 60░S,
and its descending branch near 60░N.
Over the last ten years, the global dust storm of 2007 fits perfectly in
this model. The global 2001 storm also fits nicely, with the notable exception
of the seasonal criterion, the storm being raised one season earlier after the
southern spring equinox.
The model of the üöcross-equatorial
dust stormsö has been inferred by scientists working
on the Mars Global Surveyor (MGS) data. They observed in 1999 the southward
descent of a dust activity raised on the northern polar region over Mare
Acidalium, that crossed the equator in a few days and triggered more important
dust activity in the southern hemisphere. This model responds to the following
criterions:
Ę The atmospheric circulation in the northern polar region (NPR) during
fall and winter is governed by three stationary üöwavesö created by the topography (see below), over Mare Acidalium, Utopia, and Arcadia. These
are östorm zonesö where cloud fronts will be generated, carrying both dust and water vapour ;
Ę They develop during two üöseasonal
windowsö in the northern fall (Ls 210-240░) or
northern winter (Ls 310-350░). Around the winter solstice (Ls 270░), there is only
one wave circulating and the winds are not strong enough.
Ę The cloud fronts are pushed southward if a certain number of local
conditions are fulfilled. If so, they will travel to the equator, and
eventually raise more dust clouds in the south hemisphere of Mars.
|
|
|
|
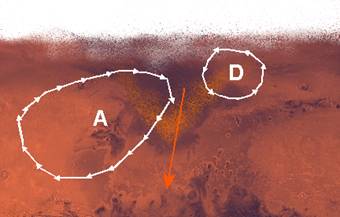
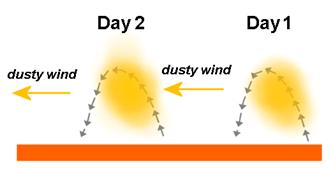
Figure 1 Left : the cross-equatorial model : in the
lowland of Acidalium during fall or winter, a storm zone exists, organized
with one high pressure system over Tharsis and one low pressure system over Acidalium.
Between the two, southward winds push a dust fronts toward the equator. Right
: image of such a southward front by MGS. Copyright NASA/JPL/MSSS. |
|
2░ ĀFocus on the
storm zones
The three storm zones are created by the eastward polar jetstream over the lowlands of the northern hemisphere,
located just after higher terrains. As the jetstream
arrived over the lowland, itÆs
deflected toward the south, and this generates anticyclonic circulation at the south-west of
the scene, and cyclonic circulation at the north-east. Between the two systems,
dominant winds are southward; they correspond also to strong returns of
descending branches from the Hadley cell. Local winds are then deflected
slightly to the west, because of trade winds.
Because of topographic differences, the storm zone over Mare Acidalium
is the stronger of the three, and the one responsible
for the vast majority of cross-equatorial storms. The
|
|
|
|
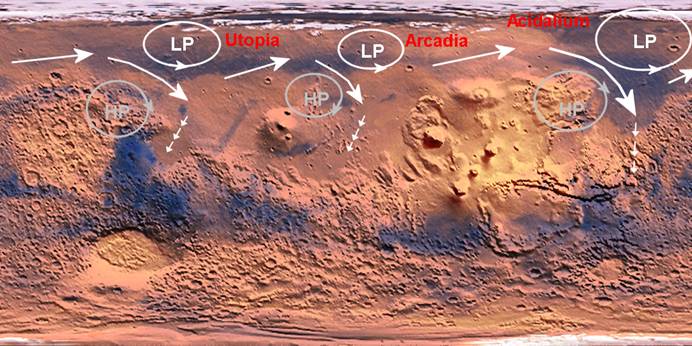
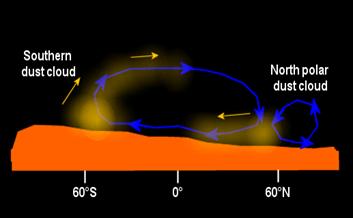
Figure 2: simplified wind pattern for the NPR during
mid-fall and mid-winter, on a relief map with albedo
features superimposed. Dashed arrows are paths for the cross-equatorial
storms. |
|
3░Ā Focus on the
Acidalium atmospheric wave
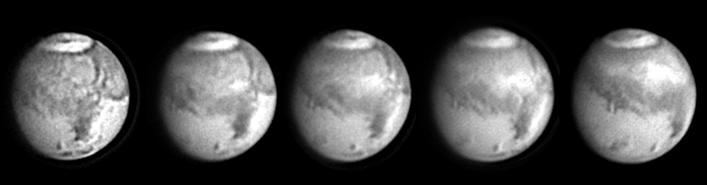
Scientists said that the waves in the NPH (north polar hood) show a üötwo sols periodsö. This means that each storm zones will generate clouds
fronts every two days when the öwaveö arrives. This explains the changes observed on the polar hood on amateur images over the apparitions of 2005 and 2007
(up to late November). The NPH over Acidalium show a öhigh phaseö on one day,
before or after the wave, when the latitude of its southern border is near
40-50░N. On the second day, a ölow
phaseö is observed, as the NPH show a öVö shape : this is
the cloud front. The point of the V shape is located at the east of Nilokeras and can descend as low as 15-20░N, although 30░N is more common.
Small dust clouds will be preferentially generated only during the ölow
phaseö, at the point of the V, on a very
narrow region located near Nilokeras and Niliacus Lacus.
This pattern of activity is precise and repeatedly observed from year to
year during the critical seasons.
|
|
|
|
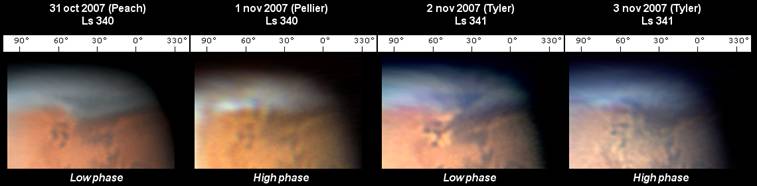
Figure 3 : amateur images of the
Acidalium atmospheric wave reveal the two days period of the wave, with an
alternation of high an low phase of the NPH. On this sequence in 2007, small
dust clouds are raised during one low phase on November 2nd. Note
the V shape of the cloud front on this day and on the 31 of October. |
|
|
|
|
|
Figure 4 : the 50-hours
oscillation of the NPH during October 2005, measured at the longitude 35░ on amateur images show the wavy nature of the circulation there. Two
dust events have been imaged, on the 13th and the 17th,
corresponding also the arrival of the cloud front during the ōlow phaseö (arrowed). The cloud on the 17th marks the beginning
of the regional storm of 2005 (see below). |
|
|
|
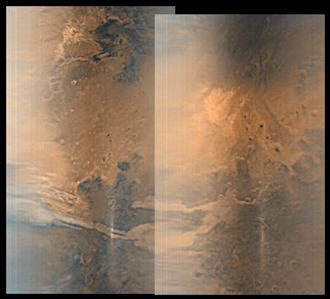
Figure 5 : another example, taken
by the MGS orbiter on march 2000, 19th
(Ls 321░).
This again shows the V shape dust front, and small dust clouds raised on Nilokeras
and Niliacus Lacus. Note the striking resemblance
with Dave TylerÆs
image above on 2 november 2007. |
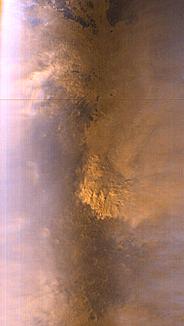
4░ The cross-equatorial dust storm of July 2003 (Ls 211-220)
The alert was sent by Don Parker with images of his on the first day of July, that show dust activity over Hyapigia
Viridis (northern
Analysis of MGS data show that this episode was triggered by a small
dust cloud travelling southward from the Utopia storm zone. Dust clouds of this
nature are easily missed by the partial amateur coverage (this one was
certainly well observed from the
|
|
|||
|
Figure 6 : RG 610 images (R+IR)
from Don Parker on July 1, 2, 3, 4, 6, 2003, showing the core of
the regional dust event. South is up. |
|||
|
|
|
|
|
|
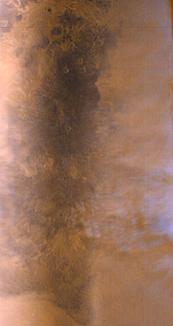
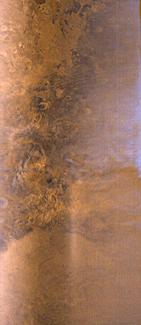
Figure 7 : MGS images showing the
descent of the precursory dust cloud, on June 28, 29, 30, and July 1st.
North is up, with Syrtis Major on the left or central sides of the frames.
Credit: NASA/JPL/MSSS. Processing: C. Pellier. |
|||
5░ The cross-equatorial event of December 2003 (Ls 314-320)
Again, the alert is sent by Don Parker with images on December 13th, that show a very bright dust cloud over
Chryse. Analysis of data from the Thermal Electro Spectrometer (TES) instrument
of the MGS probe, which provides thermal infrared images of Mars, shows that this
is the result of a long-lived low scale dust activity near Nilokeras
during the first weeks of December.
|
|
|
|
Figure 8: frames taken from a TES movie (now unavailable).
On December 12th, the activity bursts near the equator in Chryse, but
the northern path of dust from Acidalium is still visible. On December 16th,
again the northern path of dust is visible while bright dust clouds expand on
the southern hemisphere. |
|
|
|
Figure 9: first amateur images by Don Parker on December
13th, 2003. Dust is crossing the equator from Chryse to Mare
Erythraeum. |
6░ The cross-equatorial dust storm of October 2005 (Ls 308-320)
This regional event has been the first one completely imaged by amateurs,
from the very first dust clouds. Alert day is on October 18th, 2005,
with several images showing a triangle-shape dust cloud over Eos by many
observers. But the first dust cloud is visible on the 17th,
descending from Niliacus Lacus on images in Europe by
Marc Stemmelin, and on the USA by Bill Flanagan, Don
Parker and Ed Grafton. Activity remained during two weeks with an expansion
highly comparable to the December 2003 event (the two events are in fact very
similar, raised almost at the same location on the same season.
|
|
|
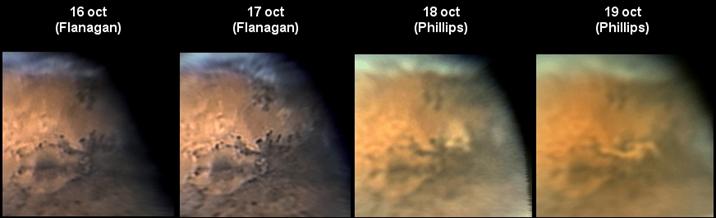
Figure 10 : sequence of the
beginning of the 2005 regional storm from amateur images. Jim Phillipsüfimage
on the 18th show the dust storm when itÆs first identified. But images taken the day
before reveal a very small dust triangle
on northern Chryse, that is the true start of the
episode (not present on the 16th, see FlanaganÆs images). The subsequent strong southern movement of the storm
is another evidence of its cross-equatorial nature. |
7░ The cross-equatorial storm model reviewed with observations
Observations bring two nuances to the model :
1)
Dust clouds do not ötravelö. As
shown by Masatsugu Minami, Director of the OAA Mars section, dust clouds are stationary during the day time [See MasatsuguÆs own
intervention]. Dust clouds look to be generated by daytime convection. But,
there must be some lifted dust travel with the dominant winds,
that will lift convective dust clouds each day farther from the original
site.
2)
The main dust front
created on the storm zone rarely manages to escape and travels south.
Cross-equatorial dust activities are generated by small dust clouds lifted in
advance of the main front.
|
|
|
|
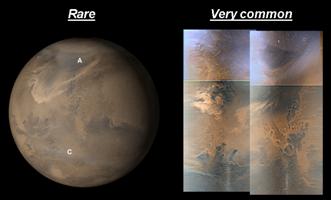
Figure 11 (left): dust activity at the Acidalium storm zone
is much more common in a form of small clouds raised in advance of the main
cloud front. Figure 12 (right): If dust clouds donÆt travel, then we must imagine another way of dust diffusion to explain why
they can follow precise paths and are not always ōrandomö. |
|
8░ Cross-equatorial storms vs. classical storms
During the last ten years, a good number of dust events have been
observed, from global to local scale, storms that have lasted months or only
days. The majority of the observed events belongs to
the northern polar region, among them the three big regional events observed in
2003 and 2005. But, it is quite curious to see that no cross-equatorial storm
manage to evolve into a global storm, when the two global events observed (2001
and 2007) belong clearly to the öclassicalö
storm models, having been originally raised
by southern dust clouds.
One would then try to look if there is any reason that might prevent
cross-equatorial storms to reach the global stage (even if we might not
consider this as being completely impossible). Here are some propositions on
this topic:
1)
The most favourable
period for global storm occurs near perihelion and northern winter solstice (Ls
250-270░), but this is also a period when northern dust activity is very low, with
no southward path opened, as scientists showed ;
2)
Any
cross-equatorial dust activity must travel with the descending branch of the
Hadley cell, closer to the ground, while southern generated dust clouds have an
immediate access to the ascending branch, so they are sent to the higher
atmosphere.
3)
Preferential
starting sites for global storms lie away from the majority of the
cross-equatorial storm paths, so those one can hardly trigger clouds where they
have more chance to go global. This because the Hellas basin, which as been
recently the most favourable site, is not located at the same longitudes than
the Mare Acidalium northern storm zone, which is by far the most active one.
|
|
|
|
Figure 13 : schema of the Hadley cell,
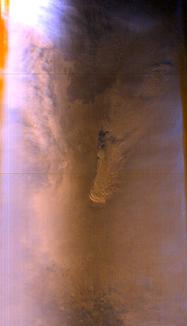
with respective path for southern and northern dust clouds. Figure 15 : example of cross-equatorial storm trapped into Valles
Marineris (MGS, 22 march 2000, Ls 322░). Those clouds have more chance of being stopped by unfavourable
topography. The 2000 activity did not survive the trap, but the 2005 activity
did so, nonetheless. |
|
|
|
|
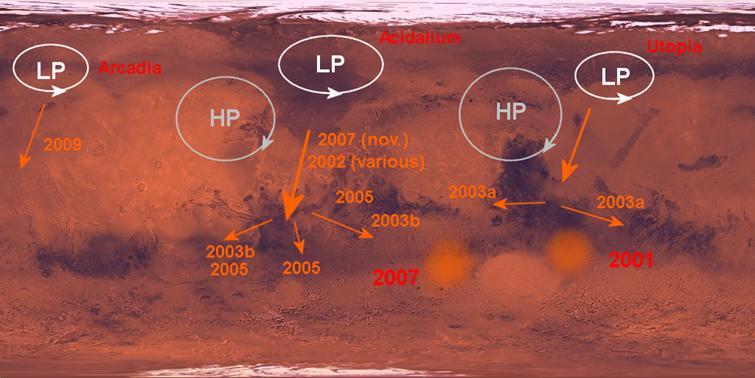
Figure 17 : map of the planet
showing the main paths of cross-equatorial storms as observed over the last decade,
and the starting sites of the 2001 and 2007 global storms. There has been
only one cross-equatorial storm near the favourable site of |
Conclusion
Further investigations might be carried out in two directions:
1)
A study of past
dust storms (before the 1990Æ) to try figure out which one might have been a cross-equatorial event,
as they look to be quite frequent
2)
A comparative study
of cross-equatorial storm seasons from martian year
to martian year
Christophe PELLIER,
SAF Mars Section Director