
from CMO #255
Pre-Storm Stage
As is well known, at the perimeter of the receding spc, the local dust disturbances tend to occur in spring because of the larger temperature gradient as well as the baroclinic gradient causing wind waves northward from the edge of the spc. The MGS found local dusts near Hellas on 8 April (143°Ls), and similarly in #245 p3009 the observations on 25 May (167°Ls) by Id, Km, Nj, Ts, Mn and others showed a coexistence of the sph and spc and pointed out a possibility that the sph conspired with small dust disturbances inside the Hellas basin. The corresponding part of the spc must have been forced to thaw rapidly, but it was not checkable. At the beginning of June at around 171°Ls, the south polar region showed a complex aspect as observed by Hk, Id, Is, Km, Mk, Mn, Nj, Nr, and Ts (cf #256). In 1986, it was at 176°Ls that Mn observed the spc to pop out from the south polar hood (sph) and to show already a shadowy low albedo terrain in the midst of the cap, and last year cautious observations were made along this line by Hg, Mo and Mn as reported in #246 p3027. As far as we observed from the side of the Solis L region, the spc was surely seen. The observations from another side by Don PARKER (DPk) on
11 June (176°Ls) made at LCM=271°W~295°W were very interesting: Hellas looked largely covered by an extraordinary gray cloud. The spc was not so evident to the south of Hellas, and the B images showed a haunted cloud activity at the south polar region (spr). We thus say the clearing-up time of the sph was not necessarily earlier this apparition.
The Size of the SPC When the Dust Storm Started
As Mn observed in 1986, the cap radius or width psi (defined below) of the spc at 176°Ls read 31°at around LCM=097°W (the snow-line therefore at 59°S). According to P B JAMES & K LUMME (Icarus 50(1982) 368), the Viking observation in 1977 at 176°Ls showed psi=33°. The polar-coordinate diagram cited in #240 p2925 shows however that it is larger than 35° at 177°Ls, and at the central longitude=045°W it even reads 40°. In 2001, Mn's observations on 11 June (176°Ls) at LCM=018°W~104°W varied from psi=38° to 41° (employed 29° in Fig 1). We thus say the spc looked larger than the critical size in 1986, and so the thawing of the spc this apparition did not necessarily start earlier than usual.
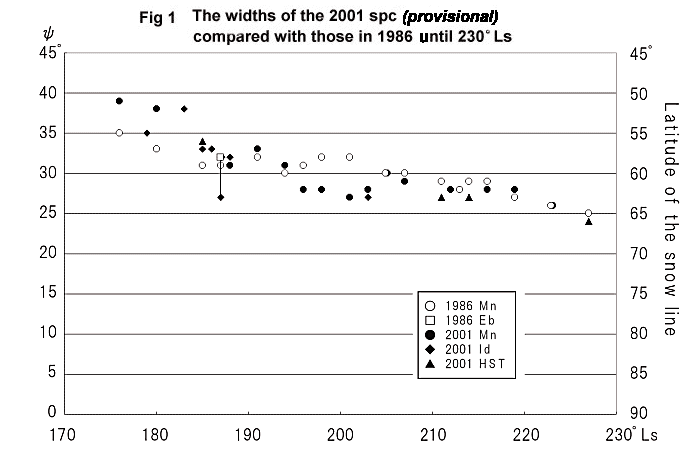
Otherwise the HST image on 26 June (185°Ls) just after the onset of the storm shows a clear spc, and according to our evaluation (by Mn & Ns), its radius is psi=34°(snow-line 56°S), while Mn's observations in 1986 at 185°Ls had a mean at psi=31°, and EBISAWA's drawing in 1986 at 187°Ls (S EBISAWA & A DOLLFUS, l'Astronomie, juillet-août 1987, p403) implies psi=32°. The results in 1986 obtained by Kyosuke IWASAKI and others (cited in #240 p2923) at 185°Ls~194°Ls prove that the psi does not exceed 32°. JAMES and LUMME report that psi was around 29° at 186°Ls in 1971, and psi went up to 31° at 190°Ls. The Viking shows psi=32° at 189°Ls. We thus say that the spc was not smaller than those observed before when the present dust storm started to develop.
Persistent Existence of the Morning Ground Fog/Frost
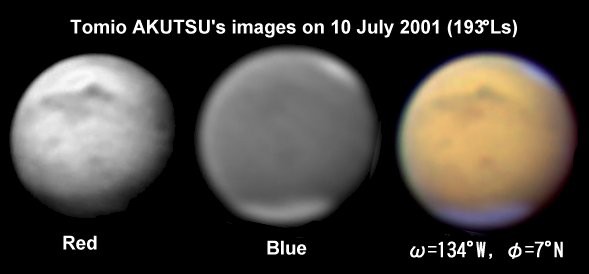
As stated in #249 p3096, an obstinate bright ground white fog was observed at the morning limb following the spc from mid-July. This was extraordinary and might have been deeply connected with the stabilisation of the dust clouds. As noted in #250 p3111, it was seen fringed by quite a dark segment when Depressiones Hellesponticæ was over there, and hence the white matter must have partly been deposited as the ground frost. This morning ground fog was again observed on 28 June (at LCM=274°W~285°W by TAN (WTn)) and on 1 July (at LCM=189°W~199°W by Mn), but they looked temporary. However the morning fog began to be evident constantly around from 7 July (191°Ls, Day 14). In addition to the visual observations on 7 July by Mn at LCM=133°W~LCM=172°W and by ISHADOH (Id) at LCM=170°W, MORITA (Mo)'s ccd images on 7 July at LCM=171°W, and Tadashi ASADA (As)'s ones on 8 July at LCM=152°W (especially G), and TAN (WTn)'s images on 9 July at LCM=163°W and so on show clearly the matter. On the rear side, it was also shown up as proven by Don PARKER (DPk)'s B image on 9 July at LCM=353°W.
The SPC was Grossly Free from the Dust Covering
The usual great dust storm occurring near the Martian perihelion (near the southern summer solstice at the present epoch) invades rapidly the spr. In 1956, the outbreak of the Noachis great dust cloud occurred on 20 August (246°Ls) (on 16 August Sadao MURAYAMA, Tokyo Science Museum , noticed an unusual aspect at the east end of Pandoræ Fr, and on 19 August at 09:40 GMT, A P LENHAM at the McDonald Observatory noticed a germ, but the photo secured at the Lowell Observatory at 10:45 GMT didn't show it, and therefore the outburst was on 20 August as observed in Japan by a number of the OAA observers), and then tended to expand to the west, and as shown well by an excellent series of photos by W S FINSEN in South Africa (Circular of the Union Observatory No.116, April 1957), the cloud concealed completely the spc 9 days later on 29 August (phi=19°S). The spc was of course quite smaller, but one of the famous drawings by A DOLLFUS on 29 August (l'Astronomie, janvier, p28 Fig 19) shows that the dust pall largely covered the spr. FINSEN's photos again prove a clear reappearance of the spc around 16 September (263°Ls, Day 30).
The 1971 Noachis great storm was entrained on 22 September (259°Ls) (one day before, A HEATH noticed a germ): According to a good series of MIYAMOTO's observations in 1971 (a total of 570 observations), the storm concealed the spc 8 days later on 30 September (phi=16°S). The 1971 storm was the greatest ever known, and the lower dust atmosphere was not cleaned for three months until the end of December (W K HARTMAN and M J PRICE, Icarus 21(1974)28). Finally in 1973, the great dust emergence at Solis L occurred on 14 October (300°Ls), and the spc turned out to be covered by the dust cloud 8 days later on 22 October (phi=18°S).
The present global dust storm in 2001 however has been mild in the sense it did never completely conceal the spc. Of course just after the onset the dust cloud came up from Hesperia-Hellas to near the spc as shown for example by the digital images made by AKUTSU (Ak) at Okinawa on 28 June (Day 4) at (LCM=205°W, 213°W, 226°W, 239°W, 258°W & 271°W). These prove that a part of the spc was covered by dusts, but the cap was not totally covered. On 29 June (Day 5), Ak's images from LCM=220°W still depicts well the spc. However his images on 30 June (Day 6) at LCM=212°W shows that the spc's peripheral area looks to have shrunk compared with that on 28 June seen from the similar angle. This was apparently because a heat transfer by the dust (cloudy or sedimentary) acted on the side facing to Hesperia and Hellas. This was seen only from the concerned side, and the images on 30 June gained by DPk at LCM=098°W at the other western hemisphere show well the big and bright spc. The fact that the peripheral segment of the spc seen from the side of M Cimmerium receded was also shown by the comparison of Id's drawing made on 29 June (Day 5) at LCM=241°W with those on 30 June (Day 6) at LCM=237°W & 247°W. Id observed on 29 June (187°Ls) at LCM=241°W, 256°W, 265°W, and on 30 June (187°Ls) at LCM=227°W~256°W. The depths of the latter day prove shorter and hence Id's psi values run inside the bracket from 32° to 27° at 187°Ls in Fig 1. Note however, the spc itself was apparent clearly though slightly duller. The aspect remained the same still when another month came in.
At the end of July, the thawing of the spc was rapidly processing on the one hand, and the tilt of the south pole was away up to phi=7°N on the other, and hence the spc was no more than a glimpse on the southern limb, but it was certainly present. On 1 August (206°Ls, Day 39), phi was still 7°N. As the following month came deep, the apparent diameter became less preferable while the presence of the spc was witnessed on the limb. Thus we can say the spc was never covered totally by the dust cloud, though its brightness and some peripheral parts were disturbed.
HST's SPCs
As to the effect of the dust on the spc, the observing notes by Id, Ts and Mn at Naha often recorded a decline of the brightness of the spc due to the presence of the yellow cloud at the latter half of July (when richly documented because of good skies at Naha). The HST team published in October four Martian images taken on 9 August (211°Ls, phi=6°N, Day 47 too late), 10 August (211°Ls), 14 August (214°Ls) and 4 September (227°Ls, phi=1°N): All images show the dusty spc in contrast with the morning white ground fog. If the fog is not so high, the colouring of the spc must be due to sedimentary sands. The sizes of the spc on these images are, as far as we evaluated, just different by ± 2° from the values one of us (Mn) obtained in 1986. The image on 14 August at around LCM=090°W shows the width psi=27° while the data secured at the Lowell Observatory at 214°Ls was psi=28°~29° (W BAUM, in Exploration of the Planetary System, edited by Woszczyk et al in 1974), and hence it may be said there must be systematically more rapid peripheral recession by the dust. The HST image on 4 September (227°Ls, phi=1°N) shows the spc which recovered the whitish brightness. The size psi=24° was not so different from the silent 1986 case. Note the image shows well the brighter Novus Mons inside the spc. The northern end of Novus Mons lies at 67°S (psi=23°) and so it is consistent with the snow edge at psi=24°.
The SPC on 9 August (211°Ls)
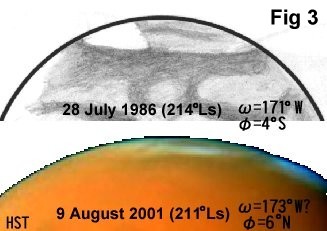 The HST image made on 9 August (211°Ls, ) conveys the spc seen from around LCM=170°W, and there are shown up several fissures inside the spc. It is one of interpretations to regard them as the sand sediments, but most possibly the fissures reflect the fast melted areas inside the spc at this season. Fortunately we have some documents in 1986 when the spc faced to us at the same season. At the season the central terrain of the spc receives such a whole-day and increasing solar insolation that there is seen a large shadowy low albedo area inside the spc implying a rapid sublimation near the center. If we refer to Mn's drawings in 1986, the top limb of the spc looked quite shadowy until 24 July 1986 (212°Ls, phi=4°S), while from 25 July 1986 (212°Ls, phi=4°S, LCM=195°W~244°W) to 29 July 1986 (215°Ls, phi=4°S, LCM=143°W~204°W), the spc showed a lower albedo segment quite inside the disk but not on the limb. So the fissures are due mainly to the topography inside as well as the heat transfer.
Deviation of the SPC from the Pole
Usually the centre of the spc begins to deviate from the geometric south pole around from 235°Ls (237°Ls according to KIEFFER), but we shall put off the case for a later review. We however consider that from the end of June to the beginning of July, the similar deviation occurred quite earlier (188°Ls on 1 July) due to the occurrence of the storm. The effected area belongs to the eastern hemisphere (180°W~360°W) and so the same possible reason seems to have come earlier. As the mid-July came in, the activity of the storm became stabilised, and the spc returned rather normal however.
Non-Retardation of the Recession
It is quite possible for the spc to delicately accelerate or decelerate its thawing according to the solar insolation irregularity, the thickness of the airborne dust, the sediment difference, or the specific topography. If the dust pall is over the spc, the suppression of insolation will delay the thawing, while the airborne dust heated will soon be so radiant that the thawing may be accelerated, and so the heat budget in this greenhouse case is delicate. The question how the presence of dust in the atmosphere affects the surface temperature was raised because, according to the Viking observations in 1977, the retreat of the spc was significantly retarded after the two global dust storms (JAMES et al, op cit; D W DAVIES, J Geophys Res 84 (1979)8289). In 1977, the dust storms started at 205°Ls and 275°Ls, and from around 235°Ls, the recession was delayed (up until ~285°Ls). The vanishing of Novus Mons is usually at around 258°Ls, but in 1977 it survived until 270°Ls (delayed by 12°Ls). Otherwise the snow line at 83°S was recorded a bit delayed compared with the preceding results.
Such a difference just by 10°Ls may be difficult to judge from the earth-based observations, but as far as we saw, the significant retardation was not observed at least until 230°Ls. Unfortunately, in Japan, no explicit information was available about Novus Mons. However Don PARKER (DPk) mentioned about the final of Novus Mons on his excellent images taken on 24 October (258°Ls, the apparent diameter=9.2"). So the recession should be said to have been not so unusual.
Remarks
In the above we reviewed about the relation of the present dust storm with the antarctic area: We postpone, but the consideration about the effect of the dust storm over the arctic region should be important because in the Viking case, the dust cloud soon gave rise to a warming of the north-polar atmosphere (Terry Z MARTIN and H H KIEFFER, J Geophys Res, 84 (1979) 2843; J R BARNES and J L HOLLINGSWORTH, Icarus, 71 (1987) 313; Bruce M JAKOSKY and Terry Z MARTIN, Icarus 72(1987)528). In the case of the first dust storm, the data were not well documented, but it was however observed after the second storm that the arctic atmospheric temperatures abruptly increased by 40K~50K. At 70°N, it was more to 80K, implying that the temperature exceeded the CO2 condensation point. The temperature begin however to decrease after 295°Ls. This apparition, the northern hemisphere faced rather preferably to us, and we expect to give a Note later about the activity of the north polar hood in relation with the warming phenomenon.
Summary
To summarise, the trend of the spc in 2001 during the period from the time just before the major dust storm was entrained (185°Ls) to around 230°Ls was as follows:
To derive this formula, pick out the points A, B, C, D, E, F, G in Fig 5.
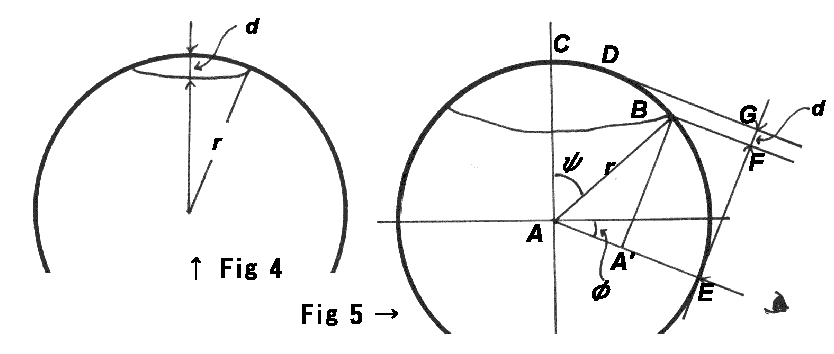
Let A' denote the intersection of AE and the line that passes B and parallel to EF (or AD),
and then A'B is just rsin(90 - psi + phi) = rcos( psi - phi).
Since EF + d = ED( =r), and EF = A'B,
we are led to rcos( psi - phi) + d = r
which is nothing but the above formula.