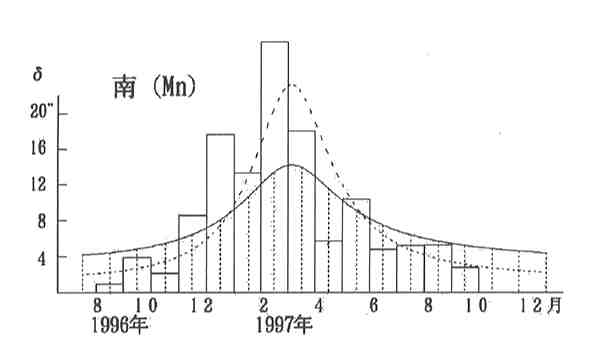
In the graphs, the curve of rigid line shows the trace of the apparent diameter delta as a function of the Earth day, while the curve by dotted line shows delta 2 (delta squared) which is depicted in such a way that its integral is equal to the integral of delta (the area bounded by the curve of delta ). A reason to take out the dotted line is that it is of the dimension of area and it may relay the rise and fall of any unit area inside the Martian surface.
In the 1996/97 apparition, HIKI (Hk) obtained a total of 83 drawings while ISHADOH (Id) 154, IWASAKI (Iw) 190, MURAKAMI (Mk) 226, and finally MINAMI (Mn) 808, and thus the numbers are divergent. So to compare we consider the total number of each observer to be equal to the integral of delta (as well as delta 2 ). Then the bar-graph shows comparatively the distribution of the observation rates as a function of month. Each month starts from the 16th day of the preceding Month to 15th of the Month.
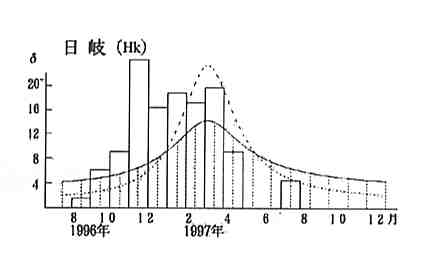

Roughly, HIKI (Hk) started early and his peak came before opposition in Feb/Mar. A fall or dip seen in the latter half was due to his personal reason (he became very busy because of work for a teacher's union). IWASAKI (Iw) was slower to start but steady up to opposition, but his pace went down in Apr/May. The peak came in June. This tendency is also seen in a previous case at p1043 (and also at p1296). Usually Iw observes much more in the evening, but in the summer in 1997 the day was longer and the planet ran down to the south-east, and hence he could not well observe after the eastern quadrature on 23 June.
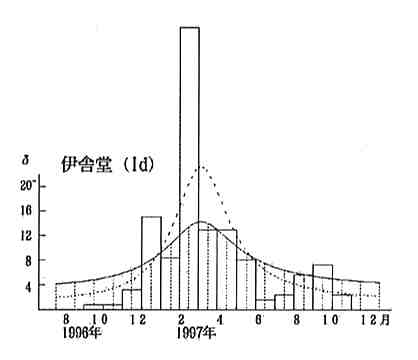

ISHADOH (Id) usually observes intensively at the period when the planet is much closer, but this time his distribution look indifferent to the rise and fall of the apparent diameter, and had a very outstanding peak in Feb/Mar. But his better part of drawings were obtained in this period. Because of this peak, his observations in other months of don't look noticeable, but they show that the observation rates were steadily dense. He has a tendency to observe densely in a month before opposition (this time in Dec/Jan; see also the graph at p1298) and this may be a good idea to become much experienced about the markings before opposition. MURAKAMI (Mk) used to work in the evening and so rather observe at night as well as when the planet was at the eastern sky. Even then he made efforts also to watch long the lower Mars in the early evening this apparition. MINAMI (Mn) was favourable in the first half and had a peak at the same interval as Id had, but showed a dip in Apr/May. In the latter half he also felt difficult because the planet went down lower to the south in the evening.
One thing that is not shown by the graphs is the way how the observers traced the markings. It is possible to make a similar graph if some does observe no more than Syrtis Mj, while it is hoped any observer trace all the angles during a forty day period. At least the five observers here represented are all adherent to any angle. We finally emphasise therefore that our observations should be done all along the angles one or twice or more before opposition until we try to make the frequency graph.