SOMETIMES
SOMETHING OLD (9)
The Martian North Polar Cap in the Early 1980s Observed
at the Kwasan and Hida Observatories
from
CMO #174 (25 April 1996 issue)
Hida
Observatory was furnished with a 65cm Zeiss refractor
in 1972 which was also aimed at the use for the planetary observations. At
Hida, from the time before MlYAMOTO retired; the
photographic observations of Mars had been done by M MATSUI. T
AKABANÉ and others. In Kwasan, Kyosuke IWASAKI
and his colleagues began from around 1977 to take the pictures of Mars by the
use of the 45cm OG, and they all started the study of the recession of the
north polar hood/cap. Their work is still going on and really we received with
thanks from Dr K IWASAKI several work including the recent evaluation of the
1994/95 north polar cap.
We
however postpone reviewing their recent work but here try to introduce their
earlier work: As far as we know, the following include their early results in
the 1980s:
[1] Kyosuke IWASAKl,
Yoshikazu SAITO, Tokuhide AKABANE, Behavior of the Martian Polar Cap, 1975-1978. J. Geophys. Res. 84 (1979) 8311.
[2] _________________, Martian North Polar Cap, 1979-1980.
J. Geoophys. Res. 87 (1982) 10,265.
[3] _________________, Martian Nonth
Polar Cap and Haze 1981-1982, Publ.. Aston. Sos. Japan 36 (1984)
347.
Here
K IWASAKI and Y SAITO worked at Kwasan and H AKABANE at Hida. As emulsion for the
photographic work was used the Tri-X Pan film. They use the negatives
directly to measure the size of the north polar cap (npc)
by a Nikon microscope at that time. The photographing itself was helped by
several members of the Observatory and students, and in 1977/78, Tadashi ASADA
certainly joined in taking the images of Mars. We don't quite remember whether
it was in 1979/80 or 1982, T ASADA was taking pictures of the planet Jupiter at
the same time, and hence K IWASAKI and T ASADA shared time each using the same
refractor every one hour: As far as we remember it looked very hard work every
time for them to repeat alternatively refinding their
own planets inside their different cameras. Furthermore the 45cm refractor was
not easy one to treat: Its eyepiece part was near the top of the tube and we
must use a long and tall ladder to reach the eyepiece (the 45cm refr has another Zeiss mirror at
the bottom of the tube and the strahl is bended back by 180° there and caught again by
a diagonal second minor near the top of the tube just like the Newtonian
reflector, while the pillar was a tall one used for the old Cook refractor by
which T SAHEKI once observed in 1937).
The
npc was the main item to observe in 1977/78, whose
apparition was alike to the recent 1992/93 one (cf
CMO #117 pl035). So the 1979/80 one treated in [2] was similar to the last
apparition in 1994/95, and hence it will be worthwhile to look back on the
older data. Title in [1] implies also that their observations in 1975/76 at
Hida met with the period just before the vernal equinox and hence look
interesting.
It
should be remembered on the other hand that we already reviewed the work of P B
JAMES in CMO #130 p1199, namely JAMES' analysis of the situations implied by
the observations of the Viking missions: This is also cited again later for
comparison. As to the preceding other work in the 1950s and 1960s, see CMO #109
p943.
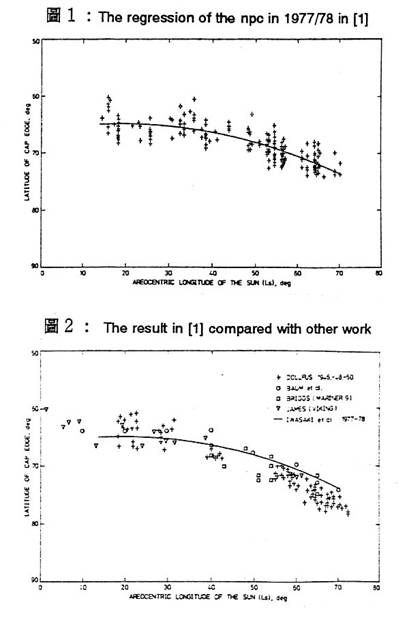
The
observations at Kwasan and Hida in 1977/78 began on 23 October 1977 (at 354°Ls)
and ended 27 May 1978 (at 094°Ls): They spent a total number of 8000 frames on
Tri-X Pan through a red filter among which they found 150 better images: The
negatives were used to microscopically measure the sizes of the npc, and they obtained the graph cited in Fig. 1, using DOLLFUS’ formulae
cos
φL =L/D
sin (φC -
DE) = 1 - (2F/D),
 where D is the diameter of Mars, L the width of the npc
along the E-W direction, and F the
depth of the npc along the CM. Each of symbols φC and φL
denotes the latitude of the cap edge. DE
is the latitude of the sub-Earth point (we usually use φ to denote it).
The second equation is essentially the same with formula l) in CMO#171 p1781
(please put 90° - φC =ψ). K
IWASAKI and others averaged φC and φL to make the data points accumulated in
Fig 1. According to their assertion, the curve there was obtained by the least
square method.
where D is the diameter of Mars, L the width of the npc
along the E-W direction, and F the
depth of the npc along the CM. Each of symbols φC and φL
denotes the latitude of the cap edge. DE
is the latitude of the sub-Earth point (we usually use φ to denote it).
The second equation is essentially the same with formula l) in CMO#171 p1781
(please put 90° - φC =ψ). K
IWASAKI and others averaged φC and φL to make the data points accumulated in
Fig 1. According to their assertion, the curve there was obtained by the least
square method.
The north polar hood (nph)
was pointed out to be cleared away at 014°Ls, with the snow line at 65°N. The npc was slowly recessed up until 050°Ls and then the
slightly rapidly, and near at 070°Ls the snow line reached 74°N as they
summarise.
Figure
2 is another graph made by K IWASAKl and others
where their data are compared with the preceding results by A DOLLFUS and others.
K IWASAKI and others declare that the agreement between them is “almost
perfect".
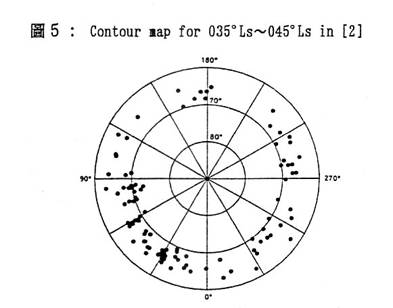
Interestingly P B JAMES whose result was once
announced in CMO #130 based on
[4] P B JAMES, Recession of Martian North Polar Cap:
1977-1978 Viking Observation, J. Geophys. Res. 84
(1979) 8332
made also
a graph where several data including those at Kwasan and Hida as reproduced in
Fig 3. Here “IWASAKI” implies the data in Fig 1 , and
"FISCHBACHER et al” reproduces the recession mode we denoted as
“BAUM-MARTIN” before. Among the Viking data, the black triangle mark
corresponds to a definite value, while a blank triangle mark implies somewhat
uncertain. It should be remarked, as once noted by the present writer (MINAMI),
that the curve by DOLLFUS between 020°Ls ~030°Ls does not well mean his
observations because of the lack of the data before 020° Ls. This will also be
inspected from the dot distribution of DOLLFUS' data in Fig 2
.
Now,
returning to [1], we ty to summarise what they show
as to the status of the nph before the vernal equinox
000°Ls based on the photographic observations in 1975/76 by Tokuhidé
AKABANÉ and others at Hida: They obtained a total of 5000 photos in 1975/76 and
especially from the better images between 340°Ls-360°Ls they deduced
interesting results by comparing the red images with the blue ones. Every blue
image conveys the nph, sometimes in a complex shape,
while the red images not necessarily. The good red images at 344°Ls showed the
north of M Acidalium to be quite dark, implying that there was no deposit at
least up 60°N. This is very important because it is sometimes believed that a
large cap exists under the nph. They also showed that
at 352°Ls from the side of Ω =270°W, the south of 65°N was free from the
deposit cap. They combine their observations with those visually done by S MlYAMOTO at that time (MIYAMOTO obtained a total of 572
drawings by use of the 45cm OG at Kwasan at that apparition from 207°Ls to
041°Is), and weakly assert that it could not be denied if there was a thin
frost cover (as to which we don't fully understand). Anyway the 19751/76
apparition was among the best in this century to observe the seasonal events
just before the vernal equinox (see CMO #117 p1035). Refer also to C B LEOVY
and others, Icarus 17 (1972) 373, where it was shown from
the Mariner 9 mission there was not witnessed any deposit upto
75°N at 340°'Ls to 004°Ls.
Note
next that the slow curve in Fig 1 invites us to change it to BAUM's 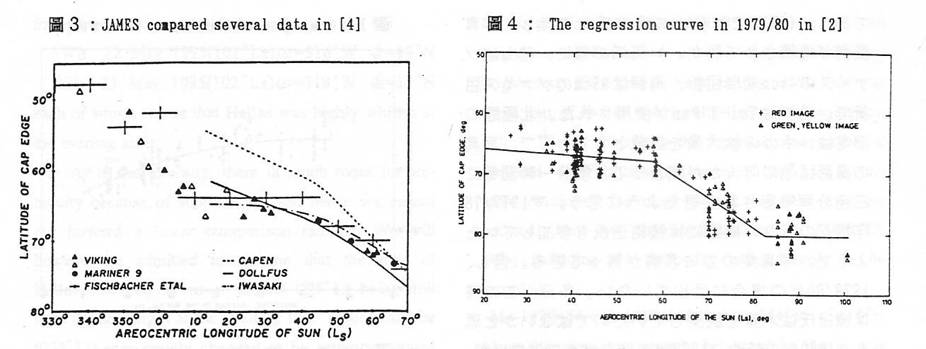 plateau
line in Fig 2 and/or Fig 3 (Baum
plateau or standstill is a terminology used in CMO #130). Figure 4 is cited from [2] dealing with the recession of the npc in 1979/80 obtained at Kwasan and Hida. The curve is
now differently depicted; but it does not necessarily imply that the
regression was completely different. It may possibly depend largely on an
accumulation way of samples. (Unpublished paper by G E FISCHBACHER, L J MARTIN
and W A BAUM in 1969 is the one that showed Baum's plateau based on the long
term photo data of the Lowell Observatory et al.)
plateau
line in Fig 2 and/or Fig 3 (Baum
plateau or standstill is a terminology used in CMO #130). Figure 4 is cited from [2] dealing with the recession of the npc in 1979/80 obtained at Kwasan and Hida. The curve is
now differently depicted; but it does not necessarily imply that the
regression was completely different. It may possibly depend largely on an
accumulation way of samples. (Unpublished paper by G E FISCHBACHER, L J MARTIN
and W A BAUM in 1969 is the one that showed Baum's plateau based on the long
term photo data of the Lowell Observatory et al.)
The
observations in [2] started from 16 September 1979 (356°Ls) and ended on 18
June 1980 (122°Ls): They secured 11400 red, 11400 green and 2800 yellow photos,
out of which 84 red; 86 green and 30 yellow better negatives were used to
measure the sizes of the npc to reach Fig 4: The
plateau continued upto 057°Ls and after 082°Ls, the
recession again stopped. They inform that there was little difference in size
through three filters before 080°Ls, but later the green light gave more
definite images.
One additional interesting description is that
their negatives showed a swell in size of the north polar bright region at
079°Ls~084°Ls, but they discarded the phenomenon from Fig 4 because, as they
say, it looked unacceptable. This inflation was also observed at the Fukui City
Observatory by T NAKAJIMA and the present writer by the use of a 15em OG and
was published in a Memoir (No 27, 1980) of the Fukui City Science Museum (now
the Fukui City Museum of Natural History), and we remember that we talked with
Dr K IWASAKI about this phenomenon in 1982 at Kwasan. The phenomenon observed
by them in 1982 was clearly described in [3] as shown in Fig 7 .
We
incidentally note that another point featuring our recession curve in the
Memoir No 27 was a slow slope at the early season from 020°Ls, and that was
somewhat contradictory to the common knowledge of the OAA Mars Section at that
time. For example Tsuneo SAHEKI, the late Former Director, described a sharp
and rapid recession curve from the early stage near the vernal equinox in his
book à la
As
far as [2] cites. C F CAPEN and his colleagues did not pay attention to the
standstill.
It
should however be remembered that contrary to the non-smooth regression aspect
with BAUM 's plateau, P B JAMES in
[5] P B JAMES, Recession of Martian North Polar Cap:
1979-1980 Viking Observations, Icarus
52 (1982) 565,
put
forward, as cited in CMO #130, the following linear recession of the npc in the period 1979/80 based on the Viking data:
Θ = 57.7° + 0.216°Ls
where
Θ denotes the latitude of the snow line. That is, JAMES regarded BAUM'S
standstill 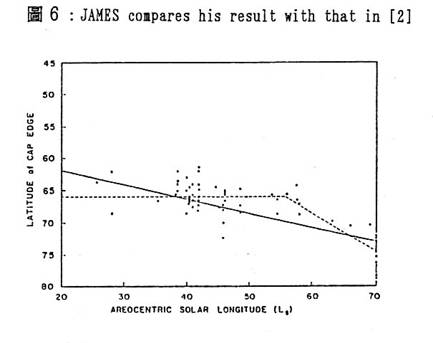 as
being absent in 1979/80, and he also reasoned it in connection with the absence
of the dust storms in the year. The difference from [2] was depicted by JAMES
in [5] and is cited here as Fig 6.
as
being absent in 1979/80, and he also reasoned it in connection with the absence
of the dust storms in the year. The difference from [2] was depicted by JAMES
in [5] and is cited here as Fig 6.
As
to this point K IWASAKI and others alluded in [3], but just said "his data
after 020°Ls in 1979-1980 apparition is quite consistent with our data obtained
concurrently" though we don't understand this saying.
In
[3], 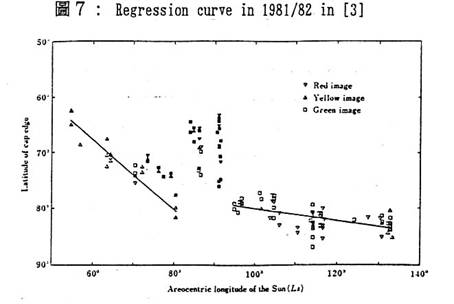 they
report their results based on the observations from December 1981 to June 1982,
starting from 055°Ls (Fig 7). This
corresponds to the next apparition in 1996/97, and here we cite their
regression curve. It should be noted that there was a swell of the north polar region around 084°Ls~091°Ls, while we could not
explicitly find the range of the LCM in [3].
they
report their results based on the observations from December 1981 to June 1982,
starting from 055°Ls (Fig 7). This
corresponds to the next apparition in 1996/97, and here we cite their
regression curve. It should be noted that there was a swell of the north polar region around 084°Ls~091°Ls, while we could not
explicitly find the range of the LCM in [3].
We finally note that in [1]~[3]
the case 2) where ψ is smaller than φ (where 90°- Θ=ψ) as
repeated in CMO #171 p1780 did not seem to be taken into account. The case
really occurred in the period, but we suspect that it was difficult to discern
the northern limb line of the disk image on the Tri-X negatives even when the npc was completely inside the disk on the negatives.
(Masatsugu MINAMI)
Back to CMO #174/Back to the CMO Index Page/Back to the Façade/Back to the CMO Home Page